Week 9: Fundamental Analysis
Get familiar with how to assess a company’s overall financial health using key financial statements, ratios, and performance indicators.
First off, what is fundamental analysis?
Fundamental analysis is a method used to determine a stock’s real or “fair market” value.
-It’s important to understand the term valuation with this, which deals with the analytical process of determining the current (or projected) worth of an asset/company
What factors go into determining the valuation?
The analyst trying to place the value of a company would look at…
Business management - how CEOs and employees are managing profit
Composition of capital structure - deals with debt and equity of a company and measures how the business uses its funds to operate growth.
Prospect of future earnings - deals with weighing success, how reliable the company will be
Market value of its assets --prices that buyers are willing to pay and what sellers will accept
This same process can be done with evaluating the value of a security. The end goal is determining a number that an investor can compare with a security’s current price to see whether the security is undervalued or overvalued by other investors.
Let’s talk about what “intrinsic value” means:
Intrinsic value is considered the real value of a stock.
So you might be wondering, how’s that value determined?
Say a company's stock was trading at $20, and after extensive research on the company, an analyst determines that it should be worth $18. Another analyst does equal research but decides it should be worth $22.
Many investors will look at the average of these estimates and assume the stock's intrinsic value to be near $20.
The benefit of conducting fundamental analysis for these investors is that…by focusing on a particular business, an investor can estimate the intrinsic value of a firm and find opportunities to buy at a discount or sell at a premium. The investment will pay off when the market catches up to the fundamentals.
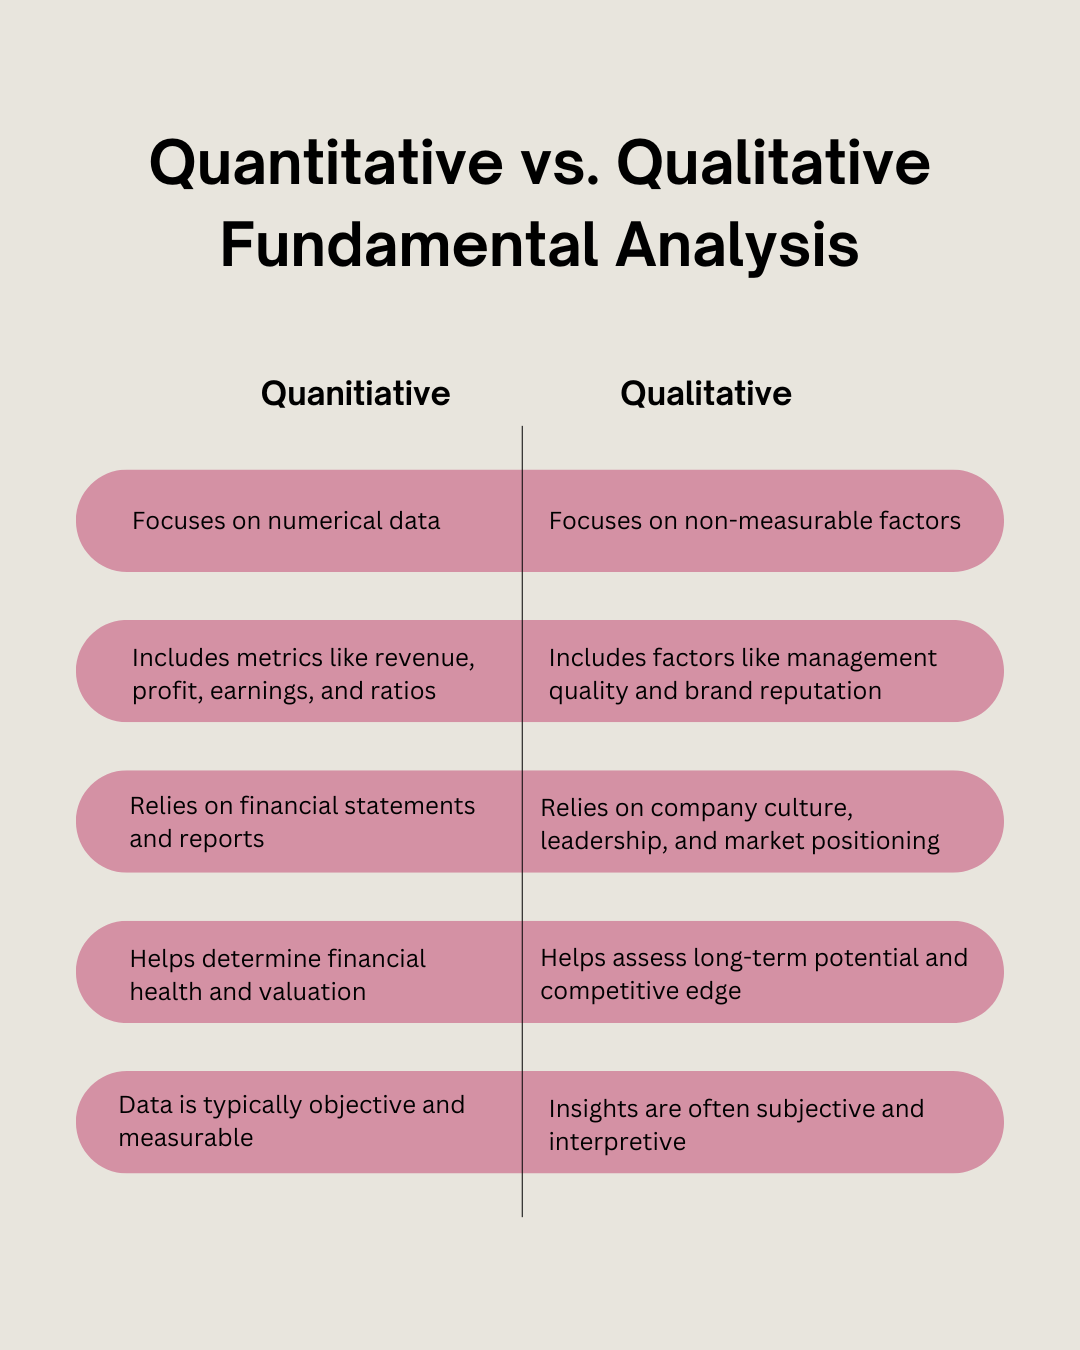
Quantitative and Qualitative Fundamental Analysis:
While fundamental analysis includes heavy numbers including revenue and profit, the quality of a company’s management is equally as important when conducting fundamental analysis.
Let’s make sure we know what these mean:
There are 4 key fundamentals to consider:
The Business model
- The company’s plan for making a profit while considering the factors of products and services being sold, identified target market, and anticipated expenses.
Competitive Advantage
- Companies long-term success is driven by it’s competitive advantage.
For example, Coca-Colas brand name has created a moat for the business allowing it to keep its competitors and influence growth and profits.
A moat refers to a business’s ability to maintain a competitive edge over it’s competitors, which is any factor that allows a company to provide goods/services similar to those offered by its competitors while sill outperforming those competitors in profits.
Ex. This could be a low-cost advantage - cheap access to raw materials saves more money in the manufacturing profits = more profit
Management/ Corporate Governance
- Refers to the policies put in place representing the relationships between the various branches of a company (management, directors, stakeholders). You will be more likely to do business with a company that is run ethically and efficiently and that management respects the interests and rights of the shareholder (you).
Industry
- Considering a company’s customer base, market share (% of total sales generated by a company) among firms, growth, regulation, and business cycles will help you determine whether the company is financially healthy and something you want to invest in.
Now that we’ve discussed qualitative funamentals, here are some quantitative fundamentals to consider:
The Balance Sheet
This holds record of company assets, liability, and equity
Let’s make sure we understand these terms.
Assets are resources the business controls (cash, inventory, machinery, etc.)
Liabilities are what the company may owe to someone else (sum of money)
Equity is the value of a business after its debt and liabilities are paid. It refers to the ownership of the asset since the owner can sell it for cash. Stocks are the prime example f=of equity as it’s what the shareholder owns, and therefore can be sold.
Formula: Assets = liabilities + shareholders equity
This represents the value of assets after the liabilities have been paid and the shareholders have received their dividends.
The income statement
Unlike the balance sheet which can be used to determine a businesses day-to-day spendings, the income statement measures a company’s performance over specific period of time (quarterly, semi-annually, annually) & focuses on presenting revenue, expenses, and profit generated from the business.
Statement of cash flows
This represents a record of business cash inflows and outflows over a period of time and focuses on 3 different things:
Cash from investing (CFI): cash used for investing in assets
Cash from financing (CFF): cash paid/received from the borrowing of funds
Operating cash flow (OCF): cash generated from day-to-day business
The cashflow represents the amount of money in the bank and is used as a more conservative approach to measure the company’s performance.
Now that we’ve discussed how fundamental analysis works, as well as the different types of fundamental analysis,you might be wondering how you can get access to all this information. You’ll be happy to know the CSI Market provides an easy chart that provides the fundamental analysis data you need.
Here’s an example using our previously discussed Coca-Cola: